Steer Outcomes with Data-Driven Intelligence
Back your decisions and execute faster with real-time insights and predictive analytics.
Execution Speed
Track project timelines and delivery to pace your rollouts and hit critical milestones.

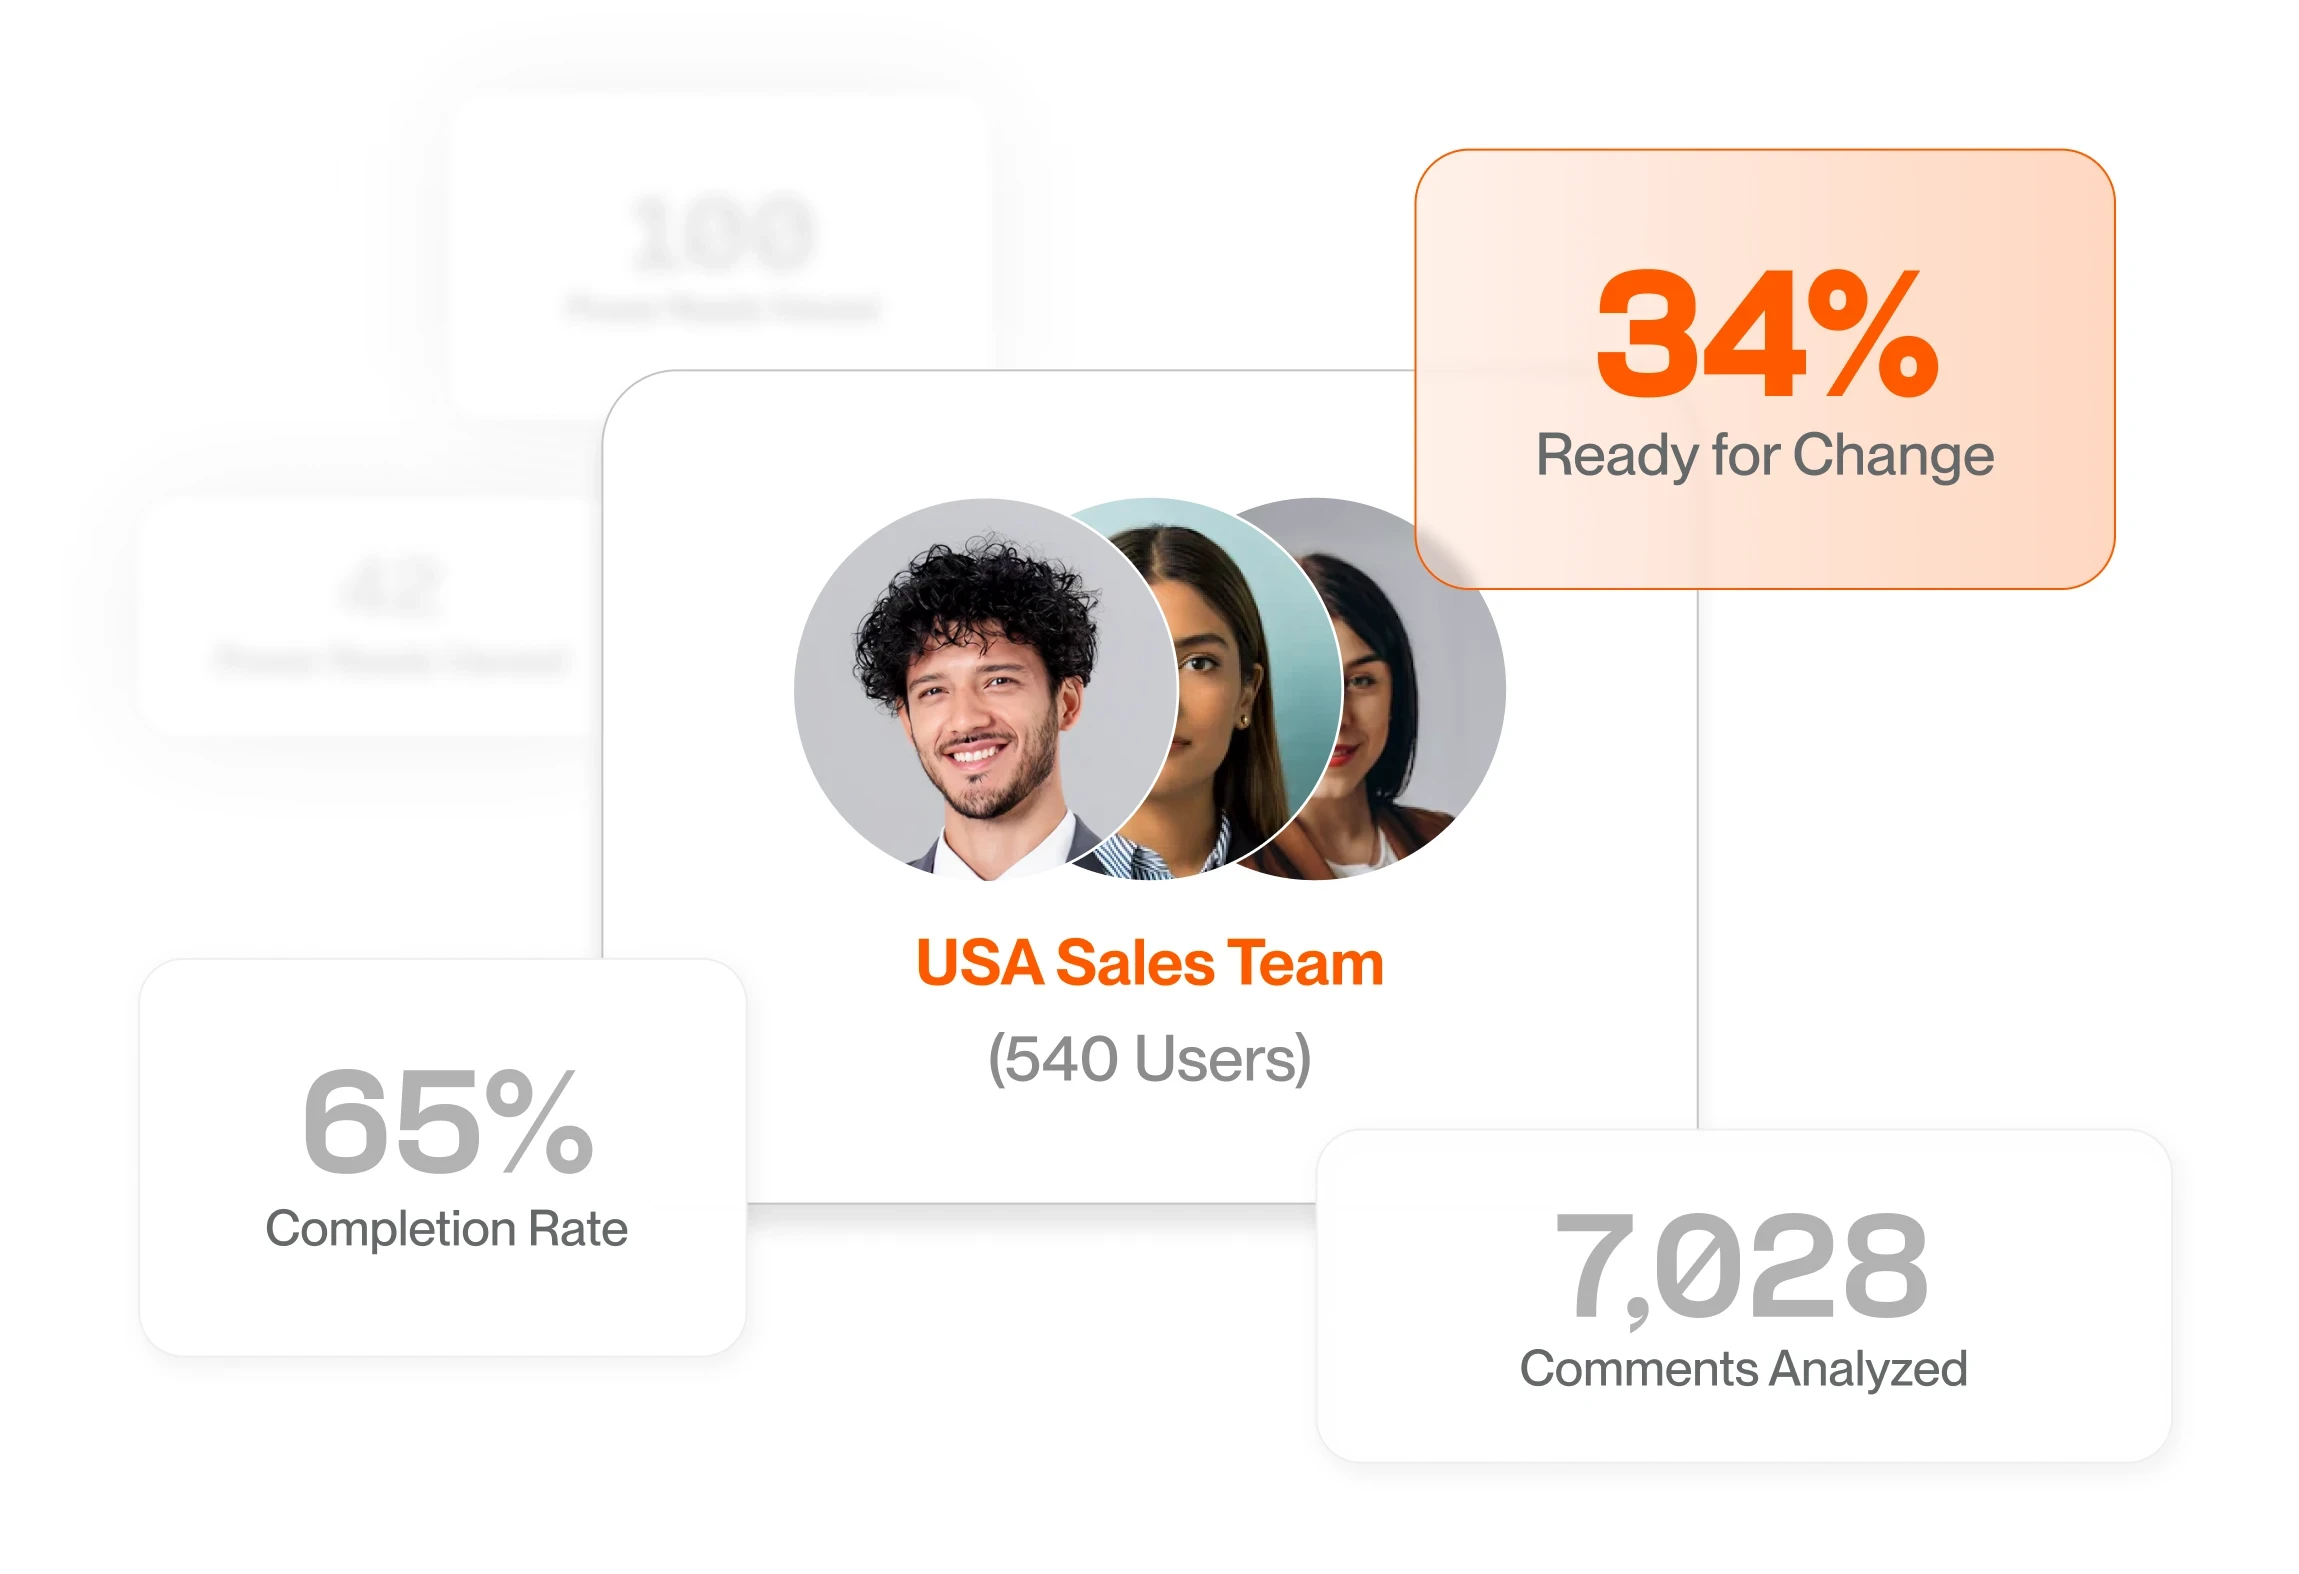
Change Readiness
Evaluate stages of awareness, capability, and behavior—so you know where to focus.
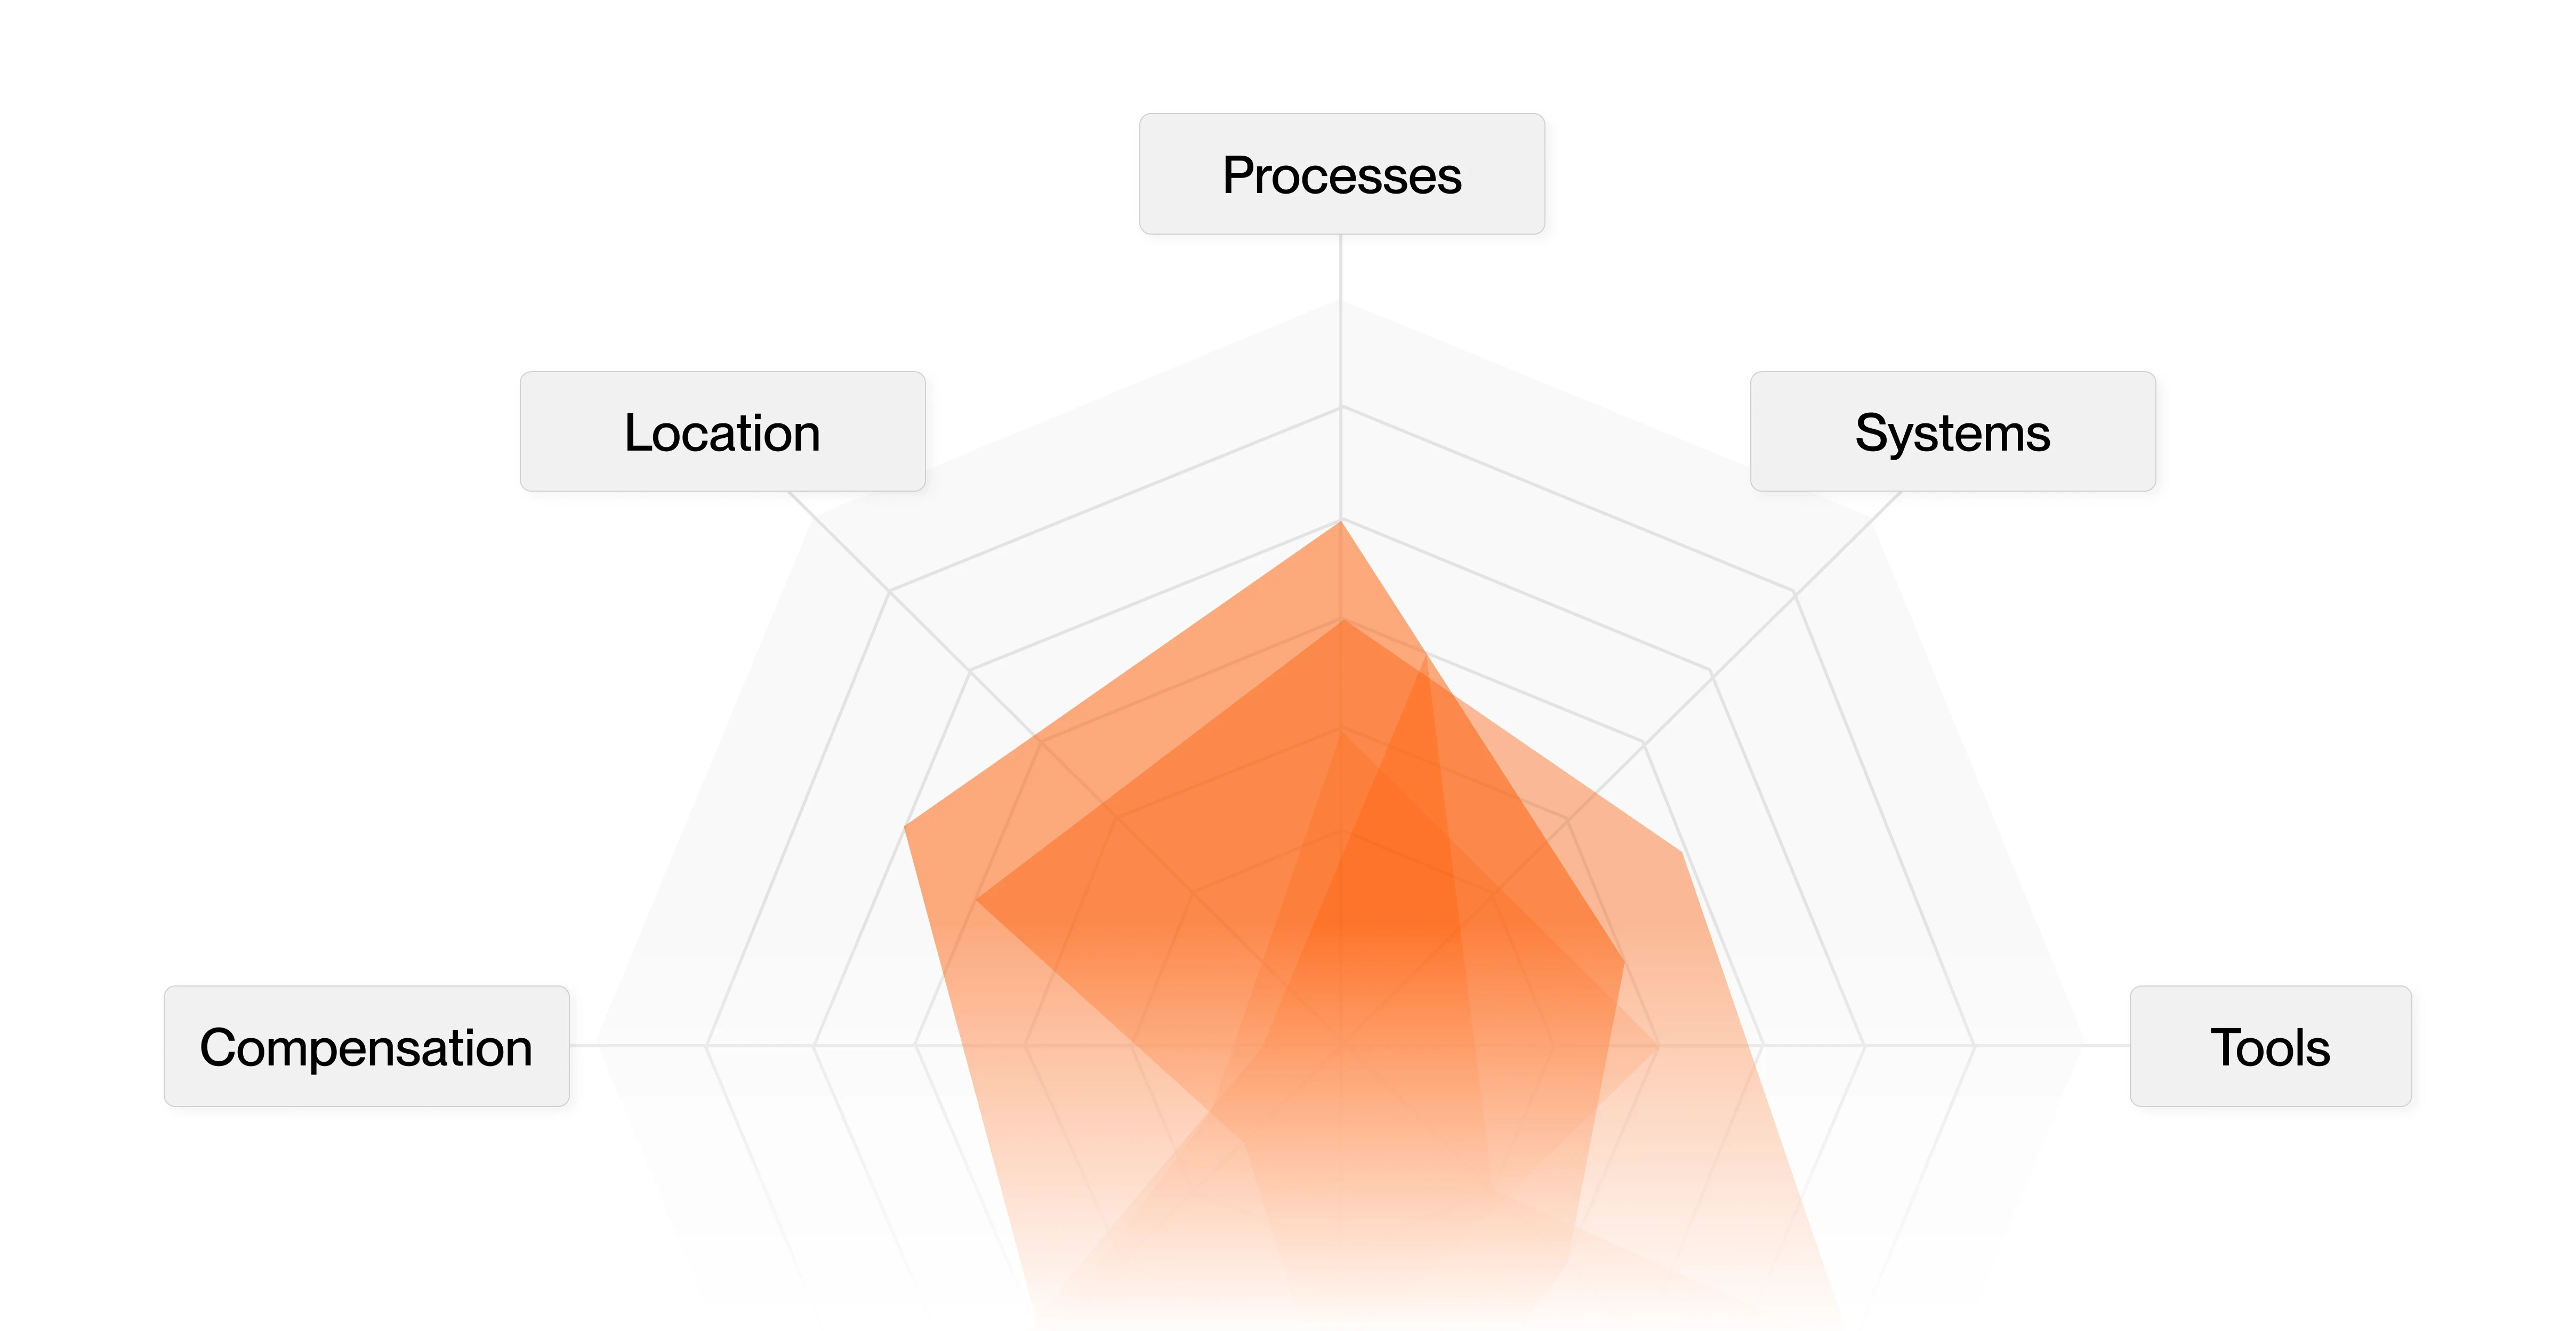
Business Impact
See which role, region, or workflow is affected to minimize operational disruption.
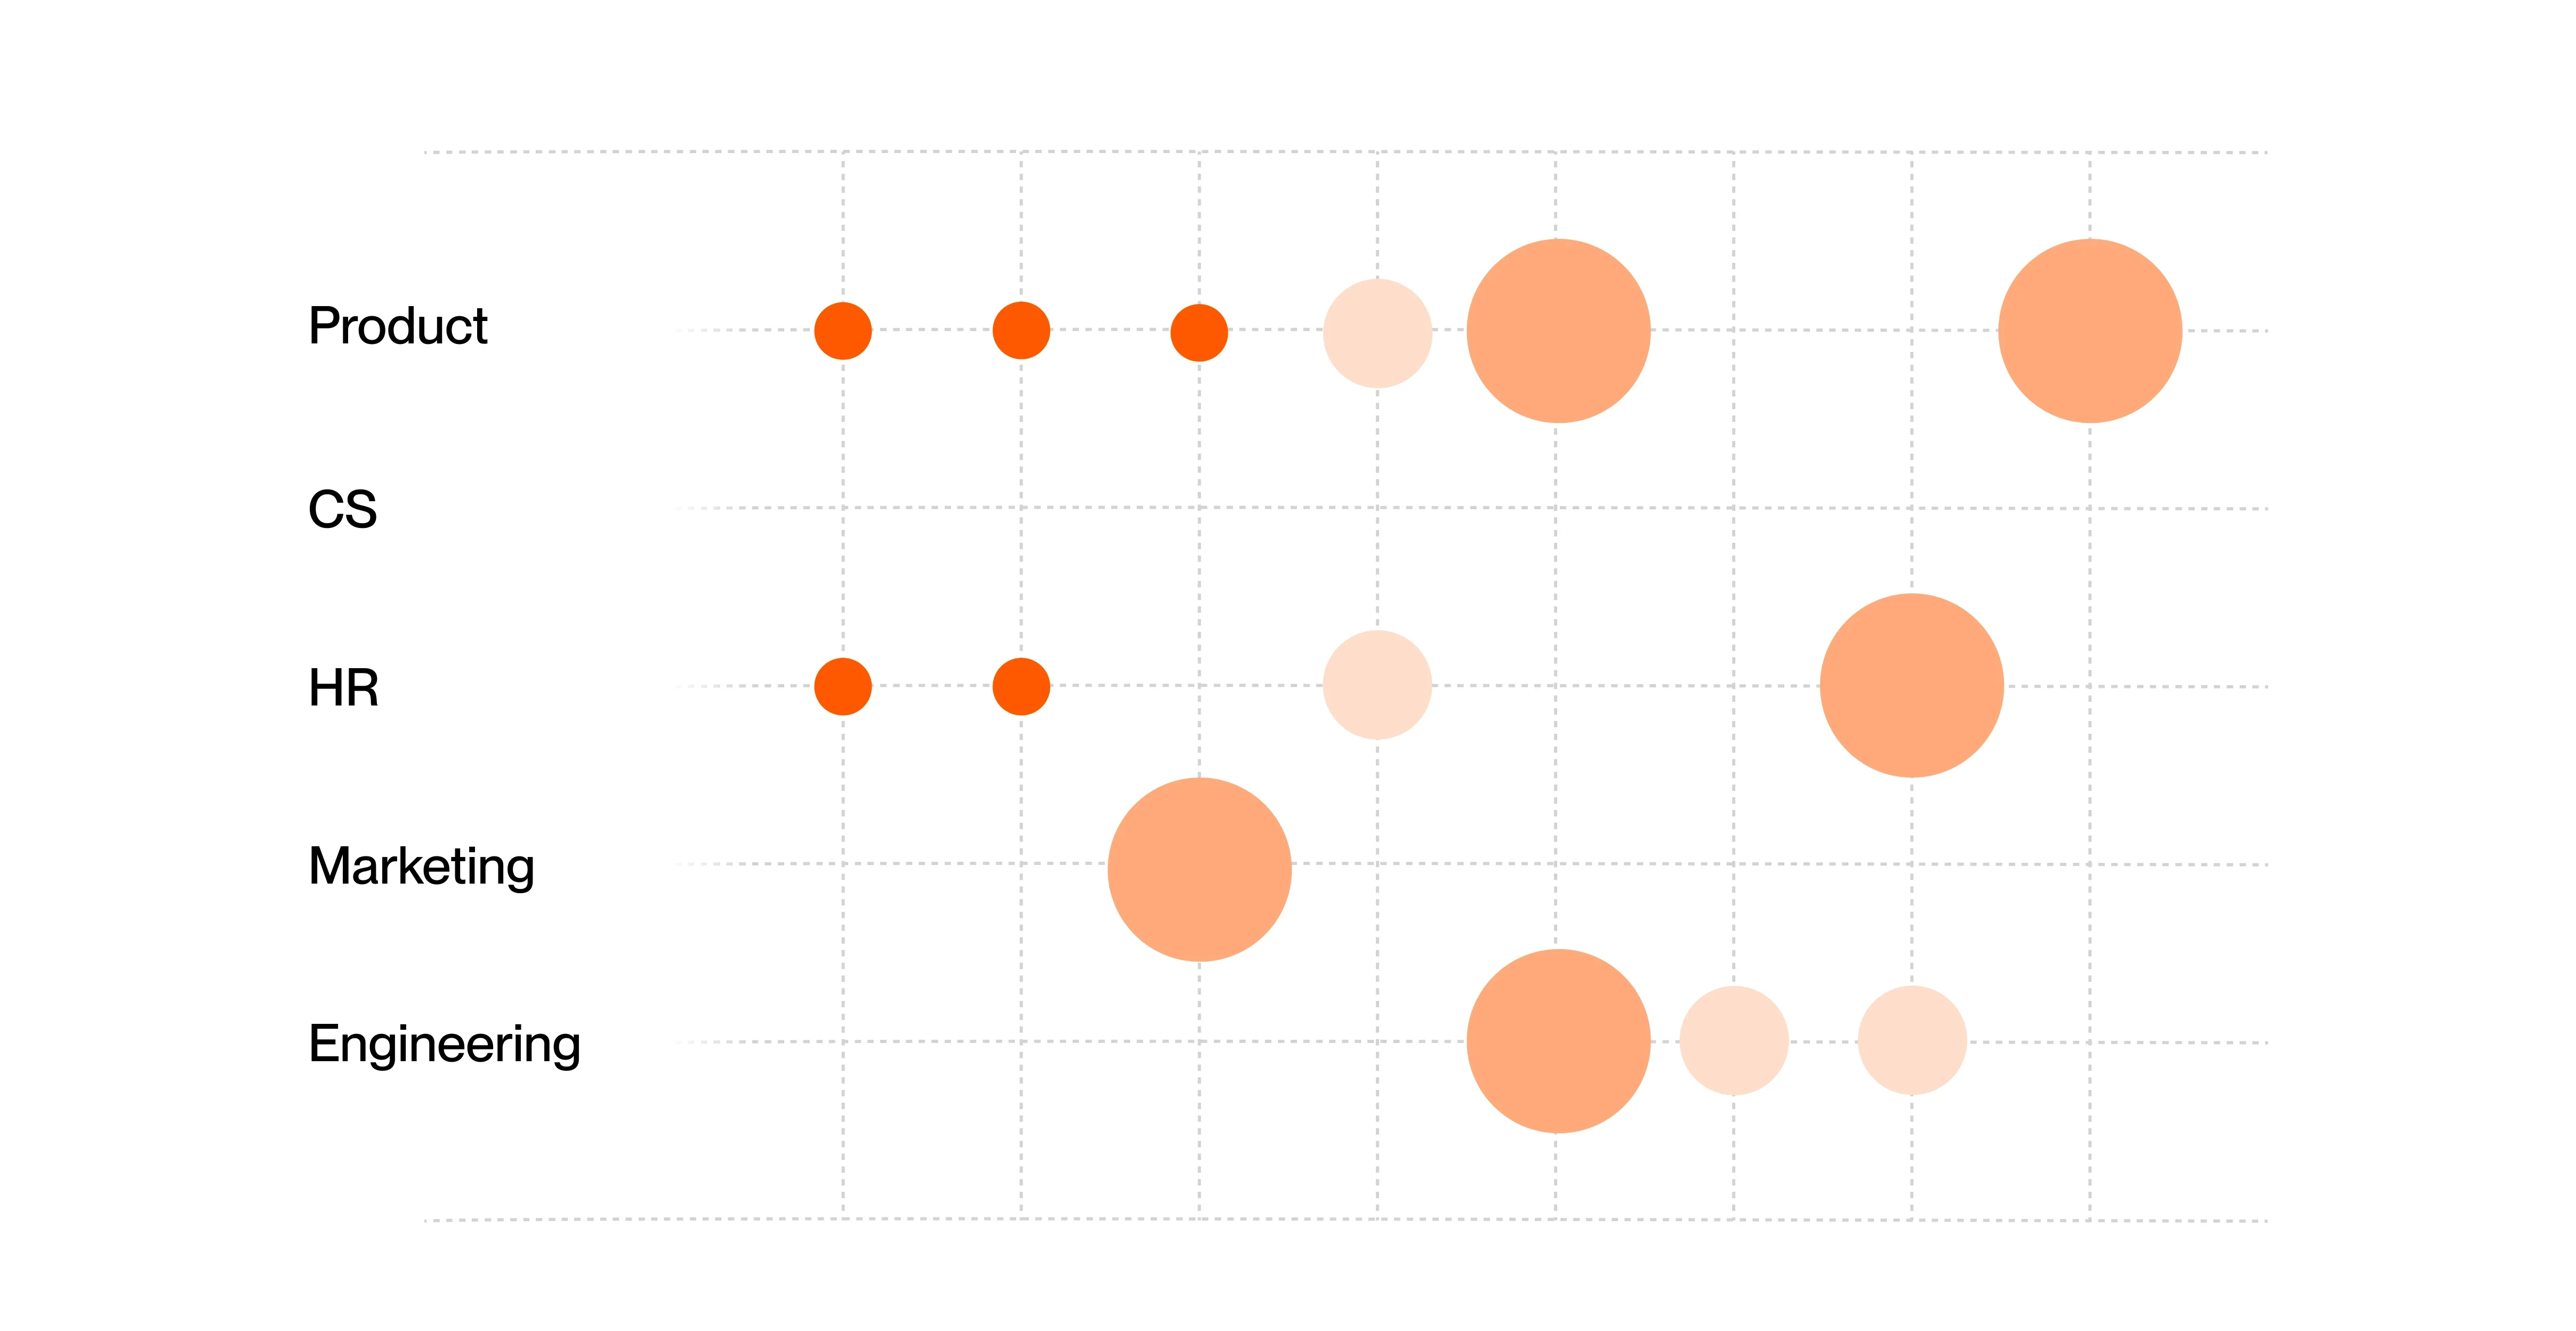
Load & Capacity
Monitor saturation across audiences to prevent bottlenecks and protect team bandwidth.


Speed Up Data Analysis
Analyze response data from activation activities across segments.
Uncover Hidden Patterns
Identify trends, inconsistencies, and potential roadblocks.
Generate Suggestions
Produce executive-ready summaries with recommended actions.
Eliminate Manual Tracking
Replace admin-heavy tracking with always-on analytics.
Catch Risks on Autopilot
Use AI to flag early signs of friction before they slow your transformation down.
Enrich Your Analysis
Push data to BI tools like Power BI and Snowflake in one click.


Analyze feedback and engagement data in real time with AI. Spot concerns and blockers as early signals—not surprises.


Executive-Ready Reports Made Simple
Skip the prep and pivot tables. Click and present with instant reports.


Start with Templates
Hone in on transformation load, impact, and execution metrics with templates.


Pinpoint Audiences
Leverage filters and selection to get granular data for stakeholder groups.


Customize Metrics
Add or remove data points to reflect strategic priorities and build your business case.

